sfdx-login


![]()

![]()


Install from source
-
Install the SDFX CLI.
-
Clone the repository:
git clone git@github.com:lodossDev/sfdx-login.git -
(Yarn)Install npm modules:
yarn install -
Link the plugin:
sfdx plugins:link .
Install as plugin
- Install plugin:
sfdx plugins:install sfdx-login
$ npm install -g sfdx-login$ sfdx COMMANDrunning command...$ sfdx (-v|--version|version)sfdx-login/0.0.6 darwin-x64 node-v8.12.0$ sfdx --help [COMMAND]USAGE $ sfdx COMMAND...sfdx force:auth:username:login
This command adds a simple login mechanism missing from sfdx.
USAGE
  $ sfdx force:auth:username:login

OPTIONS
  -c, --clientid=clientid                         The connected app client id.
  -k, --secret=secret                             The connected app secret key.
  -p, --password=password                         (required) Salesforce password+security token.

  -s, --server=server                             (required) [default: https://test.salesforce.com] The instance
                                                  endpoint i.e. loginUrl

  -u, --username=username                         (required) Salesforce username.

  --json                                          format output as json

  --loglevel=(trace|debug|info|warn|error|fatal)  logging level for this command invocation

EXAMPLE
  $ sfdx force:auth:username:login --username=lodoss118@saasforceltd.com
                                             --password=xxxxxxxxxx

           Logged in as: lodoss118@saasforceltd.com (xxxxxxxxxxx)
           Organization: SAASFORCE LTD (xxxxxxxxxxx)
See code: src/commands/force/auth/username/login.ts
Debugging your plugin
We recommend using the Visual Studio Code (VS Code) IDE for your plugin development. Included in the .vscode directory of this plugin is a launch.json config file, which allows you to attach a debugger to the node process when running your commands.
To debug the sfdx force:auth:username:login command:
- Start the inspector
If you linked your plugin to the sfdx cli, call your command with the dev-suspend switch:
$ sfdx sfdx force:auth:username:login --dev-suspendAlternatively, to call your command using the bin/run script, set the NODE_OPTIONS environment variable to --inspect-brk when starting the debugger:
$ NODE_OPTIONS=--inspect-brk bin/run force:auth:username:login- Set some breakpoints in your command code
- Click on the Debug icon in the Activity Bar on the side of VS Code to open up the Debug view.
- In the upper left hand corner of VS Code, verify that the "Attach to Remote" launch configuration has been chosen.
- Hit the green play button to the left of the "Attach to Remote" launch configuration window. The debugger should now be suspended on the first line of the program.
- Hit the green play button at the top middle of VS Code (this play button will be to the right of the play button that you clicked in step #5).
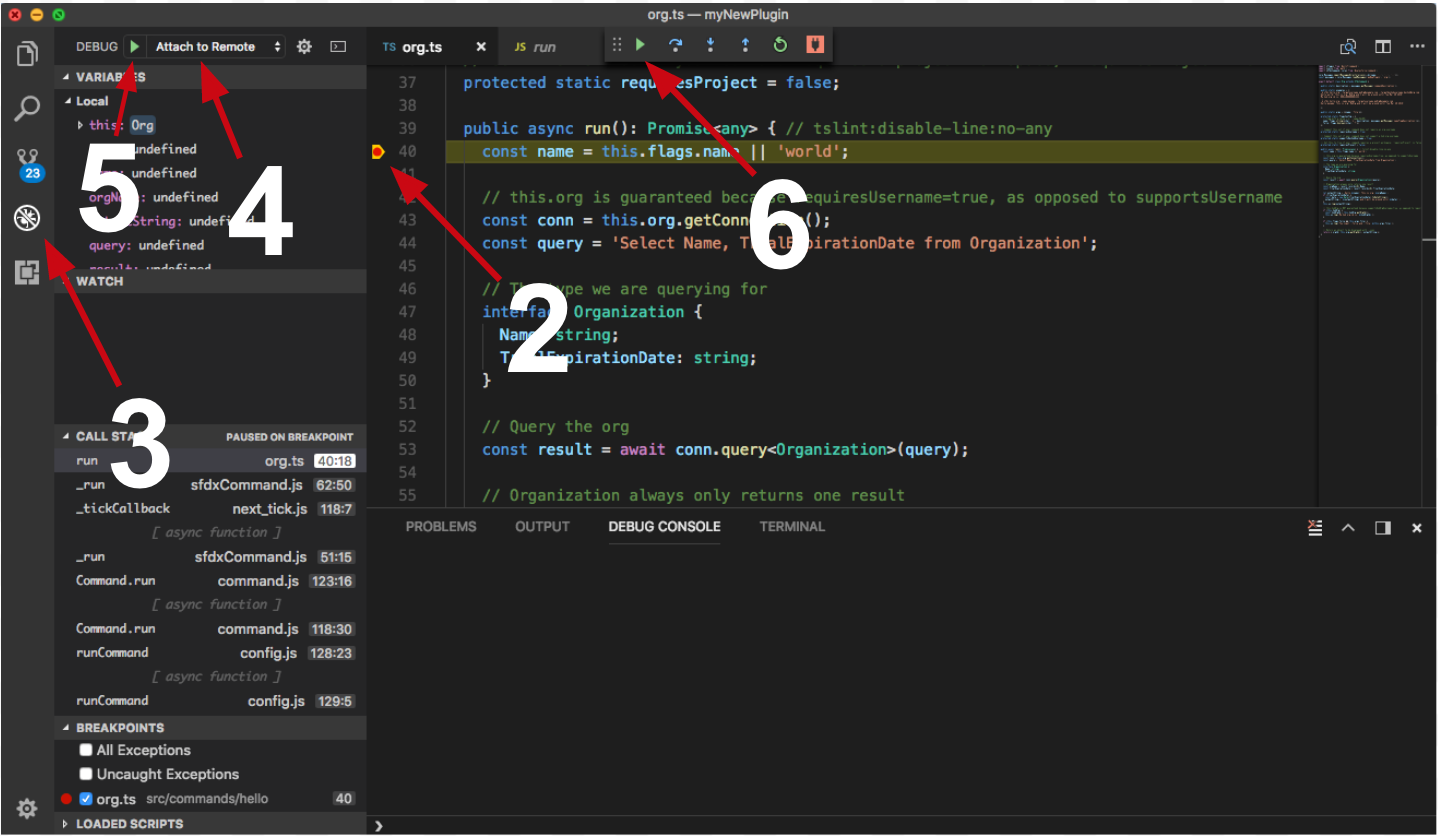
Congrats, you are debugging!