sfdx-plugin-rmtk
Release Management Toolkit sfdx plugin


$ npm install -g sfdx-plugin-rmtk
$ sfdx COMMAND
running command...
$ sfdx (-v|--version|version)
sfdx-plugin-rmtk/0.1.3 darwin-x64 node-v14.4.0
$ sfdx --help [COMMAND]
USAGE
  $ sfdx COMMAND
...
sfdx rmtk:branch:cleanup -m <directory> [-v <number>] [--json] [--loglevel trace|debug|info|warn|error|fatal|TRACE|DEBUG|INFO|WARN|ERROR|FATAL]sfdx rmtk:package:filter -p <filepath> [--json] [--loglevel trace|debug|info|warn|error|fatal|TRACE|DEBUG|INFO|WARN|ERROR|FATAL]sfdx rmtk:package:prettify [-p <array>] [-f <array>] [-s <array>] [-l <filepath>] [--json] [--loglevel trace|debug|info|warn|error|fatal|TRACE|DEBUG|INFO|WARN|ERROR|FATAL]sfdx rmtk:package:validate -p <filepath> -m <filepath> [--json] [--loglevel trace|debug|info|warn|error|fatal|TRACE|DEBUG|INFO|WARN|ERROR|FATAL]
sfdx rmtk:branch:cleanup -m <directory> [-v <number>] [--json] [--loglevel trace|debug|info|warn|error|fatal|TRACE|DEBUG|INFO|WARN|ERROR|FATAL]
Delete profiles, empty pre-deploy folder, empty post-deploy-folder, reset package.xml and destructiveChanges.xml
USAGE
  $ sfdx rmtk:branch:cleanup -m <directory> [-v <number>] [--json] [--loglevel
  trace|debug|info|warn|error|fatal|TRACE|DEBUG|INFO|WARN|ERROR|FATAL]

OPTIONS
  -m, --manifestfolder=manifestfolder                                               (required) Manifests folder path

  -v, --version=version                                                             [default: 48] API version in
                                                                                    package.xml

  --json                                                                            format output as json

  --loglevel=(trace|debug|info|warn|error|fatal|TRACE|DEBUG|INFO|WARN|ERROR|FATAL)  [default: warn] logging level for
                                                                                    this command invocation
See code: lib/commands/rmtk/branch/cleanup.js
sfdx rmtk:package:filter -p <filepath> [--json] [--loglevel trace|debug|info|warn|error|fatal|TRACE|DEBUG|INFO|WARN|ERROR|FATAL]
filter sources from a package.xml file for convert or deploy
USAGE
  $ sfdx rmtk:package:filter -p <filepath> [--json] [--loglevel
  trace|debug|info|warn|error|fatal|TRACE|DEBUG|INFO|WARN|ERROR|FATAL]

OPTIONS
  -p, --package=package                                                             (required) package.xml file path to
                                                                                    filter source with

  --json                                                                            format output as json

  --loglevel=(trace|debug|info|warn|error|fatal|TRACE|DEBUG|INFO|WARN|ERROR|FATAL)  [default: warn] logging level for
                                                                                    this command invocation
See code: lib/commands/rmtk/package/filter.js
sfdx rmtk:package:prettify [-p <array>] [-f <array>] [-s <array>] [-l <filepath>] [--json] [--loglevel trace|debug|info|warn|error|fatal|TRACE|DEBUG|INFO|WARN|ERROR|FATAL]
reorder element and fix indentation in package.xml and destructiveChanges.xml files
USAGE
  $ sfdx rmtk:package:prettify [-p <array>] [-f <array>] [-s <array>] [-l <filepath>] [--json] [--loglevel
  trace|debug|info|warn|error|fatal|TRACE|DEBUG|INFO|WARN|ERROR|FATAL]

OPTIONS
  -f, --profiles=profiles                                                           list of profiles file path separated
                                                                                    by ':'

  -l, --labels=labels                                                               Custom Labels filepath

  -p, --packages=packages                                                           list of packages (package and
                                                                                    destructive) file path separated by
                                                                                    ':'

  -s, --permission-sets=permission-sets                                             list of permission sets file path
                                                                                    separated by ':'

  --json                                                                            format output as json

  --loglevel=(trace|debug|info|warn|error|fatal|TRACE|DEBUG|INFO|WARN|ERROR|FATAL)  [default: warn] logging level for
                                                                                    this command invocation
See code: lib/commands/rmtk/package/prettify.js
sfdx rmtk:package:validate -p <filepath> -m <filepath> [--json] [--loglevel trace|debug|info|warn|error|fatal|TRACE|DEBUG|INFO|WARN|ERROR|FATAL]
validate package.xml element are in the sources
USAGE
  $ sfdx rmtk:package:validate -p <filepath> -m <filepath> [--json] [--loglevel
  trace|debug|info|warn|error|fatal|TRACE|DEBUG|INFO|WARN|ERROR|FATAL]

OPTIONS
  -m, --metadata-describe=metadata-describe                                         (required) metadata-describe.json
                                                                                    file path to validate package with

  -p, --package=package                                                             (required) package.xml file path to
                                                                                    validate package with

  --json                                                                            format output as json

  --loglevel=(trace|debug|info|warn|error|fatal|TRACE|DEBUG|INFO|WARN|ERROR|FATAL)  [default: warn] logging level for
                                                                                    this command invocation
See code: lib/commands/rmtk/package/validate.js
Debugging your plugin
We recommend using the Visual Studio Code (VS Code) IDE for your plugin development. Included in the .vscode directory of this plugin is a launch.json config file, which allows you to attach a debugger to the node process when running your commands.
To debug the hello:org command:
- Start the inspector
If you linked your plugin to the sfdx cli, call your command with the dev-suspend switch:
$ sfdx hello:org -u myOrg@example.com --dev-suspendAlternatively, to call your command using the bin/run script, set the NODE_OPTIONS environment variable to --inspect-brk when starting the debugger:
$ NODE_OPTIONS=--inspect-brk bin/run hello:org -u myOrg@example.com- Set some breakpoints in your command code
- Click on the Debug icon in the Activity Bar on the side of VS Code to open up the Debug view.
- In the upper left hand corner of VS Code, verify that the "Attach to Remote" launch configuration has been chosen.
- Hit the green play button to the left of the "Attach to Remote" launch configuration window. The debugger should now be suspended on the first line of the program.
- Hit the green play button at the top middle of VS Code (this play button will be to the right of the play button that you clicked in step #5).
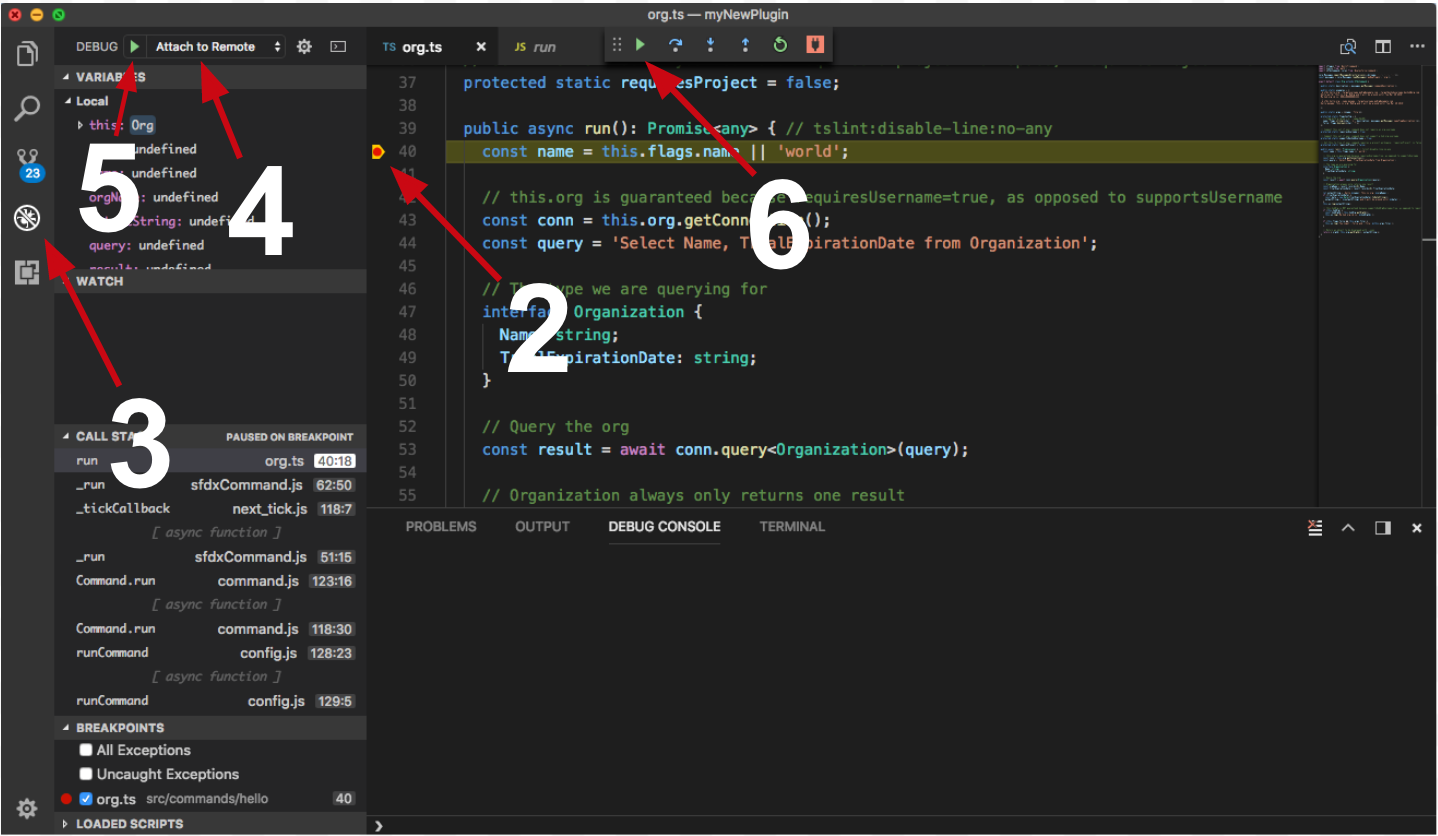
Congrats, you are debugging!
