sfdx-ftw


![]()

![]()


SFDX For(ce) The Win
$ npm install -g sfdx-ftw$ sfdx COMMANDrunning command...$ sfdx (-v|--version|version)sfdx-ftw/0.1.2 darwin-x64 node-v10.15.1$ sfdx --help [COMMAND]USAGE $ sfdx COMMAND...sfdx ftw:apex -c <string> [-r <url>] [-v <string>] [--apiversion <string>] [--json] [--loglevel trace|debug|info|warn|error|fatal|TRACE|DEBUG|INFO|WARN|ERROR|FATAL]sfdx ftw:config:get [--json] [--loglevel trace|debug|info|warn|error|fatal|TRACE|DEBUG|INFO|WARN|ERROR|FATAL]sfdx ftw:config:set name=value... [--json] [--loglevel trace|debug|info|warn|error|fatal|TRACE|DEBUG|INFO|WARN|ERROR|FATAL]
sfdx ftw:apex -c <string> [-r <url>] [-v <string>] [--apiversion <string>] [--json] [--loglevel trace|debug|info|warn|error|fatal|TRACE|DEBUG|INFO|WARN|ERROR|FATAL]
Validate the result of Apex code.
USAGE
  $ sfdx ftw:apex -c <string> [-r <url>] [-v <string>] [--apiversion <string>] [--json] [--loglevel
  trace|debug|info|warn|error|fatal|TRACE|DEBUG|INFO|WARN|ERROR|FATAL]

OPTIONS
  -c, --checker=checker                                                             (required) Name of the validation
                                                                                    suite to run

  -r, --remotecheck=remotecheck                                                     URL of remote directory from which
                                                                                    to retrieve checks. Overrides the
                                                                                    'defaultremotecheck' config setting.

  -v, --targetdevhubusername=targetdevhubusername                                   username or alias for the dev hub
                                                                                    org; overrides default dev hub org

  --apiversion=apiversion                                                           override the api version used for
                                                                                    api requests made by this command

  --json                                                                            format output as json

  --loglevel=(trace|debug|info|warn|error|fatal|TRACE|DEBUG|INFO|WARN|ERROR|FATAL)  [default: warn] logging level for
                                                                                    this command invocation
See code: lib/commands/ftw/apex.js
sfdx ftw:config:get [--json] [--loglevel trace|debug|info|warn|error|fatal|TRACE|DEBUG|INFO|WARN|ERROR|FATAL]
USAGE
  $ sfdx ftw:config:get [--json] [--loglevel trace|debug|info|warn|error|fatal|TRACE|DEBUG|INFO|WARN|ERROR|FATAL]

OPTIONS
  --json                                                                            format output as json

  --loglevel=(trace|debug|info|warn|error|fatal|TRACE|DEBUG|INFO|WARN|ERROR|FATAL)  [default: warn] logging level for
                                                                                    this command invocation
See code: lib/commands/ftw/config/get.js
sfdx ftw:config:set name=value... [--json] [--loglevel trace|debug|info|warn|error|fatal|TRACE|DEBUG|INFO|WARN|ERROR|FATAL]
USAGE
  $ sfdx ftw:config:set name=value... [--json] [--loglevel
  trace|debug|info|warn|error|fatal|TRACE|DEBUG|INFO|WARN|ERROR|FATAL]

OPTIONS
  --json                                                                            format output as json

  --loglevel=(trace|debug|info|warn|error|fatal|TRACE|DEBUG|INFO|WARN|ERROR|FATAL)  [default: warn] logging level for
                                                                                    this command invocation
See code: lib/commands/ftw/config/set.js
Debugging your plugin
We recommend using the Visual Studio Code (VS Code) IDE for your plugin development. Included in the .vscode directory of this plugin is a launch.json config file, which allows you to attach a debugger to the node process when running your commands.
To debug the hello:org command:
- Start the inspector
If you linked your plugin to the sfdx cli, call your command with the dev-suspend switch:
$ sfdx hello:org -u myOrg@example.com --dev-suspendAlternatively, to call your command using the bin/run script, set the NODE_OPTIONS environment variable to --inspect-brk when starting the debugger:
$ NODE_OPTIONS=--inspect-brk bin/run hello:org -u myOrg@example.com- Set some breakpoints in your command code
- Click on the Debug icon in the Activity Bar on the side of VS Code to open up the Debug view.
- In the upper left hand corner of VS Code, verify that the "Attach to Remote" launch configuration has been chosen.
- Hit the green play button to the left of the "Attach to Remote" launch configuration window. The debugger should now be suspended on the first line of the program.
- Hit the green play button at the top middle of VS Code (this play button will be to the right of the play button that you clicked in step #5).
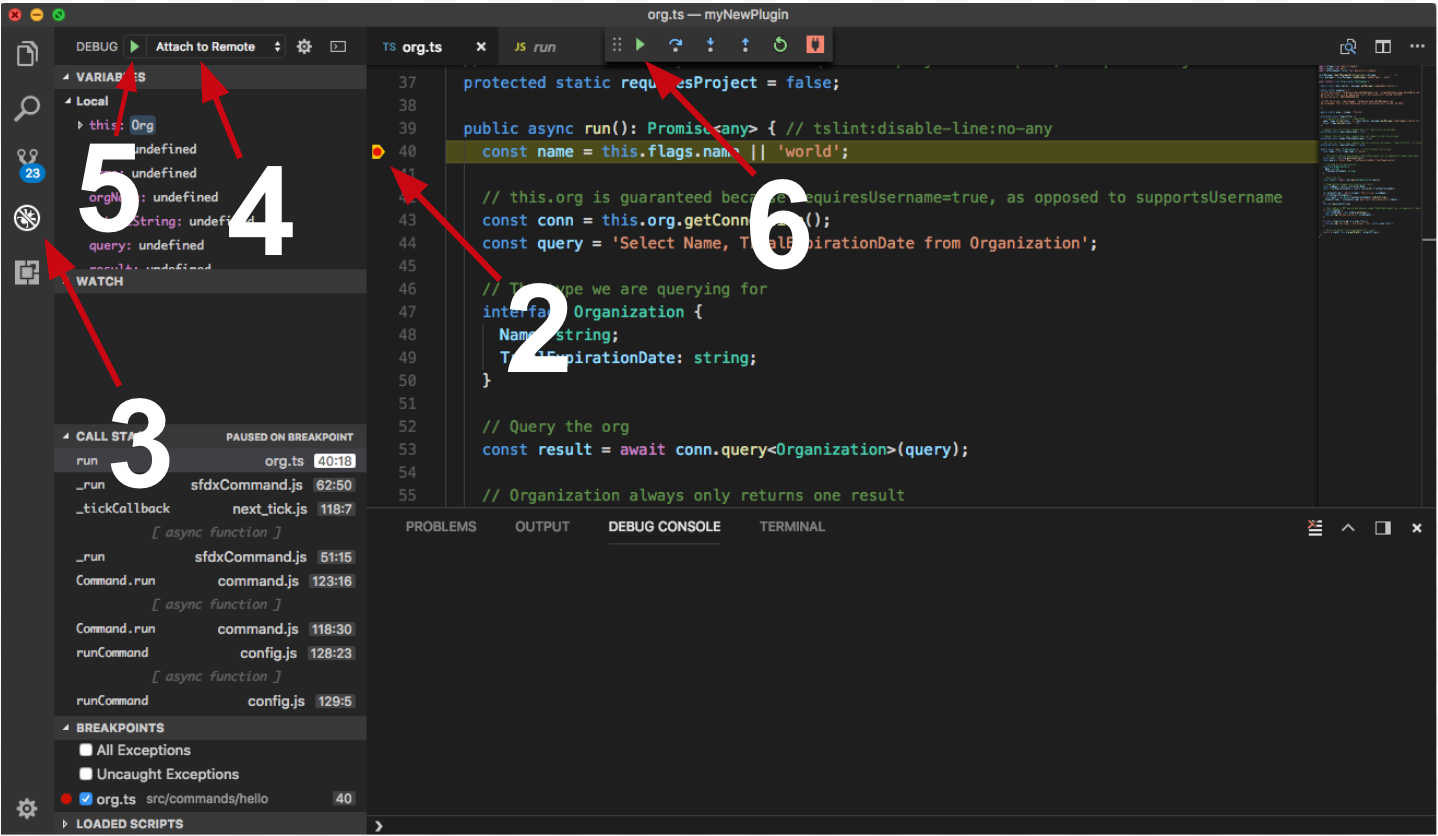
Congrats, you are debugging!