node-red-node-ui-table
A Node-RED UI widget node which displays data as a table.
Install
Either use the Editor - Menu - Manage Palette - Install option, or run the following command in your Node-RED user directory (typically ~/.node-red) after installing Node-RED-dashboard.
npm i node-red-node-ui-table
Usage
This table node expects msg.payload to contain an array of data, one object per row.
Each data row object should have the same set of keys because the keys in the object are used as the column names.
Both examples can be imported from the Node-RED Editor - Menu - Import - Examples
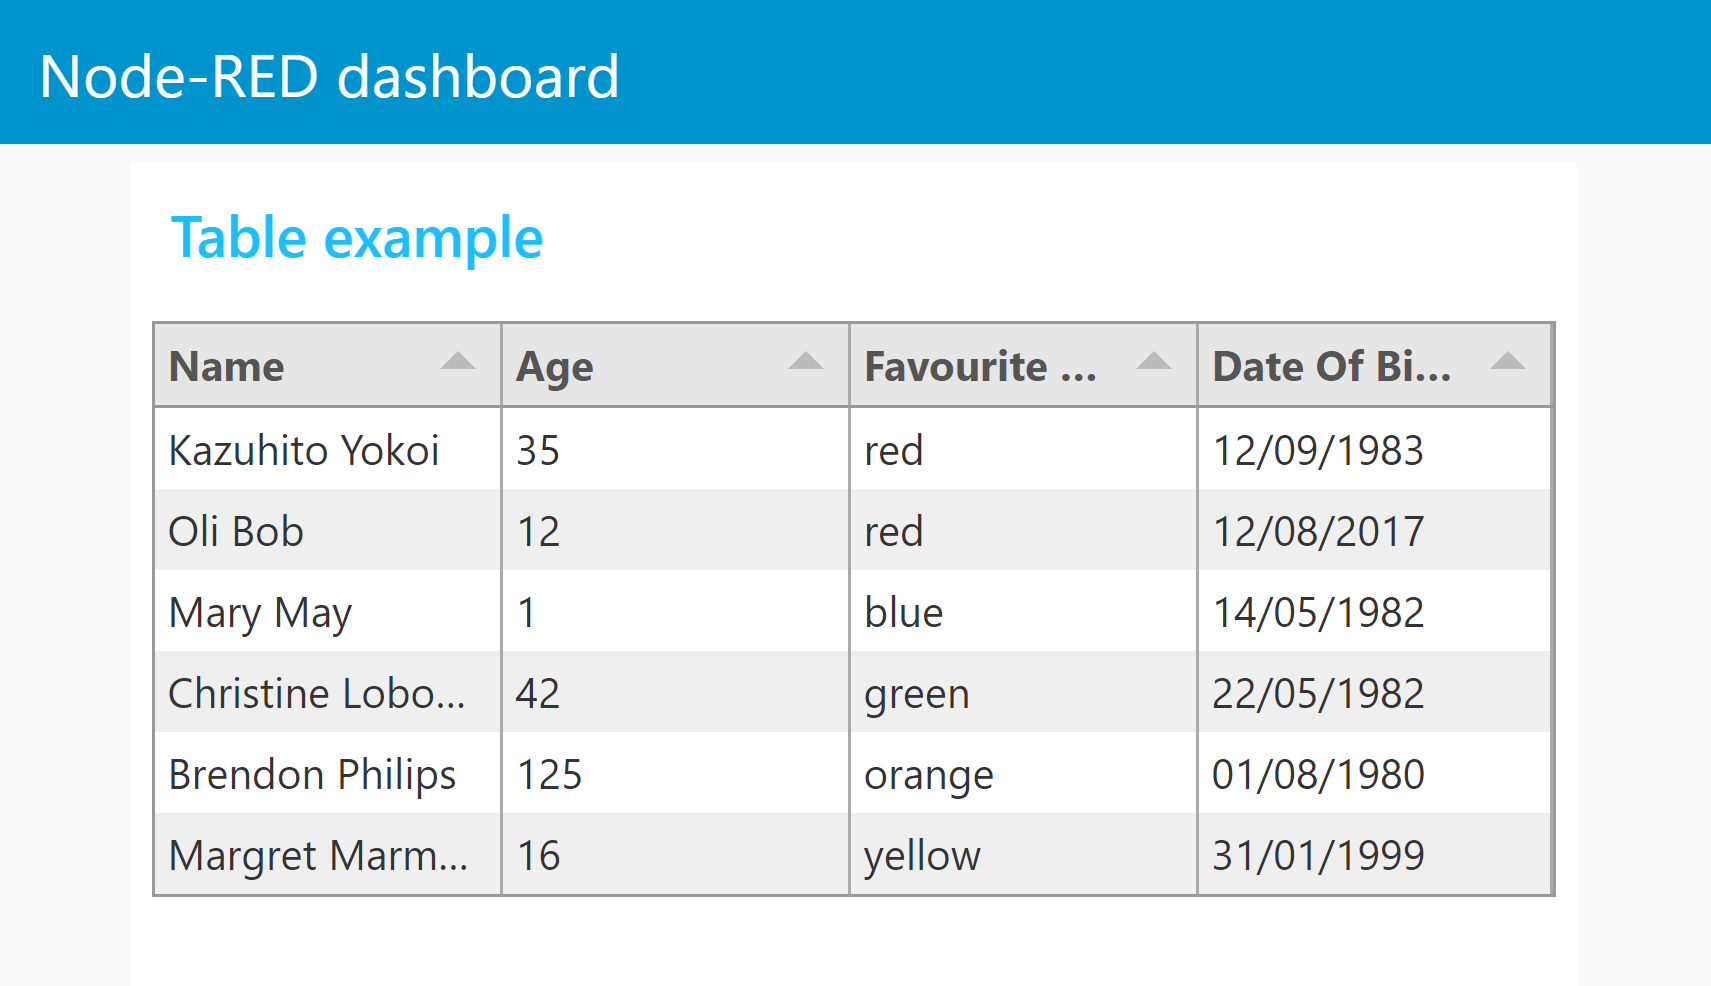
Simple Table
With no configuration the node will try to create a table with equally spaced columns of simple text for each row provided, using the keys as column titles.
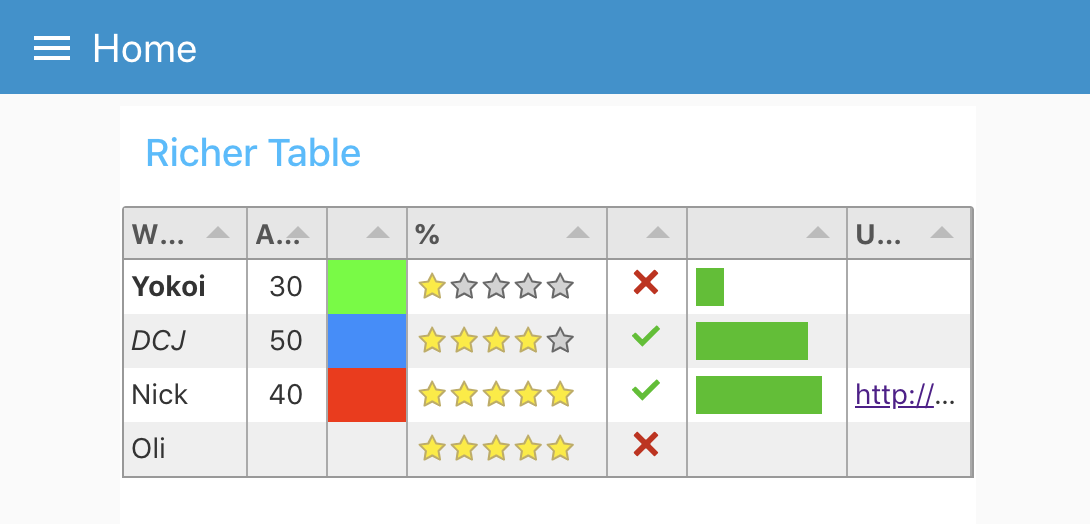
Richer Table
The columns can be configured manually. If so then only the msg.payload properties defined will be displayed. You can then also define the Title, Width, Alignment and Format of the column.
- Title: Text for the column title (or blank).
- Width: Either a number of pixels or percentage of the overall table width. e.g. 150 or 20%. Leave blank for automatic, equally spaced to fill the available space.
- Align: Column alignment, left, centre or right.
-
Format: Formatting of the input.
- Plain Text - Simple text values.
- HTML - Rich html to allow text Formatting - NOTE: this is raw un-sanitised HTML.
- Link - URL link to a web page.
- Image - Source (src) URL of an image to display.
- Progress - a progress bar from 0 to 100.
- Traffic - Red/Amber/Green indicator light set by numbers in the range 0-33-67-100.
- Color - HTML color name, or hex value (#rrggbb) to fill the cell.
- Tick/Cross - Tick or Cross symbol, boolean true/false, numeric 1/0 or text "1"/"0".
- Stars - Number of stars - numeric 0 to 5.
- Row Number - Current row number.
Example data
[
    {
        "Name": "Kazuhito Yokoi",
        "Age": "35",
        "Favourite Color": "red",
        "Date Of Birth": "12/09/1983"
    },
    {
        "Name": "Oli Bob",
        "Age": "12",
        "Favourite Color": "cyan",
        "Date Of Birth": "12/08/2017"
    }
]
advanced features
ui-table is based on the tabulator module. You can find an excellent in depth documentation here with many examples here.
send commands to ui-table
Instead of sending an array to ui-table this node to replace the complete table data ui-table also accepts an object as payload to send commands. Beside data manipulation you can set filters and do many other things with commands. The object must have the following properties
-
commanda valid tabulator function such asaddRow,replaceDataoraddFilter -
arguments(optional) array of arguments for that function -
returnPromise(optional) a boolean value.trueif the function should return a promise message. See tabulator documentation which commands will return promises
example
{"payload":{
    "command":"addData",
    "arguments":[
        {
            "facility":"daemon",
            "facilityCode":3,
            "severity":"info",
            "severityCode":6,
            "tag":"systemd[1]",
            "timestamp":"2020-01-02T19:17:39.793Z",
            "hostname":"localhost",
            "address":"127.0.0.1",
            "family":"IPv4",
            "port":38514,
            "size":80,
            "msg":"some demo data",
            "id":2351
        },
        true
    ],
    "returnPromise":true
    }
}
By sending only changed or new data to ui-table it is possible to update the table very fast by only sending the new data down to cell level. Or huge amounts of data could be sent like logs.
important notices
Data which is sent to ui-table through commands is not cached by ui-table! The flow has to take care to update the table for new clients connection or dashboard tab changes! Tabulator does not limit the amount of data it holds. It is quite efficient in showing tables with a couple of thousand rows. If it the data exceeds the capabilities of the clients browser it will crash with an out of memory error without notice.
Example flow "4 sending commands.json" file can be found in the examples folder or installed directly using menu/import/examples/ui-table. This flow shows a basic implementation how the flow can keep a cached copy of all table data and add/delete or update selective rows. Most nodes have info text available in the info/help tab.
control ui-table by sending msg.ui_control messages
ui-table can be customized by sending configuration data to msg.ui_control.tabulator.
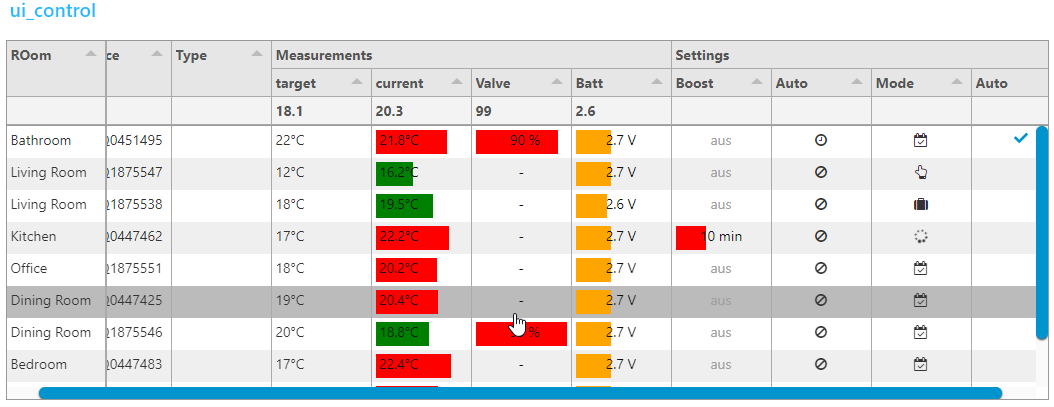
by adding headers, footers, line or column grouping it is sometimes not possible to determine the amount of lines. Therefore the height can be defined by sending msg.ui_control.customHeight=lines.
Example flow "3 ui_control table.json" file can be found in the examples folder
- grouped columns by nesting column definition in
ui_control.tabulator.columns - first column
frozenfrom horizontal scrolling -
formatterParamsto define min/max, color, legend or other parameters forprogressandplanTextformatters - functions to format legend values
// add a unit
function(cell, formatterParams, onRendered){
    return cell.getValue()+"°C";
}
or more sophisticated using html
// convert Number to Icons
function(cell, formatterParams, onRendered){
    var html="<i class=\"";
    switch(cell.getValue()) {
        case 0: html+="fa fa-calendar-check-o"; break;
        case 1: html+="fa fa-hand-o-up"; break;
        case 2: html+="fa fa-suitcase"; break;
        case 3: html+="fa fa-spinner fa-spin fa-fw"; break;
    }
    html+='\"></i>';
    return html;
}-
topCalcfor average and min/max calculations - custom icons for
tickCrossformatter -
tickformatter -
groupByparameter to use group lines.groupHeaderfunction to format legend and adding html tags (Insert a field name in the groupBy paramter at the end of json in the change node to use this feature) -
columnResizedcallback function to receive a message when the user resize a column
function(column){
    var newColumn = {
        field: column._column.field,
        visible: column._column.visible,
        width: column._column.width,
        widthFixed: column._column.widthFixed,
        widthStyled: column._column.widthStyled
    };
    this.send({
        ui_control:{callback:'columnResized',columnWidths:newColumn}
    });
}- use
this.send({})to pass result to Node-RED. (to avoid a loopback addui_control.callback="someText")
this.send({topic: "anyTopic",payload:"anyPayload",ui_control: {callback:"myCallback"}});- all parameters are named according to tabulator documentation. Use
fieldinstead ofPropertyused in node configuration - no validation of
msg.ui_controldata is performed! So if you don`t get the results you expect take a look on your browsers console.