d3.horizon


A D3 based component that renders a Horizon type area chart.
Heavily based in previous work by Mike Bostock's d3-horizon plugin, extended to support HTML5 Canvas rendering and migrated for D3 v4+ compatibility.
Check out the examples:
Quick start
import d3 from 'd3-horizon';or using a script tag
<script src="//unpkg.com/d3-horizon"></script>then
d3.horizon()
    .data(<myData>)
    (<domElement>);
API reference
Initialisation
d3.horizon({ configOptions })(<domElement>)| Config options | Description | Default |
|---|---|---|
| useCanvas: boolean | Whether to use HTML5 Canvas (true) or SVG (false) as rendering method. |
true |
Methods
| Method | Description | Default |
|---|---|---|
| width([px]) | Getter/setter for the chart width. | <window width> |
| height([px]) | Getter/setter for the chart height. | 40 |
| data([array]) | Getter/setter for chart data, as an array of data points. The syntax of each item is defined by the x and y accessor methods. |
[] |
| x([fn or str]) | Getter/setter for the data point accessor function to extract the x axis values. A function receives the data point as input and should return a number. A string indicates the object attribute to use. |
d => d[0] |
| y([fn or str]) | Getter/setter for the data point accessor function to extract the y axis values. A function receives the data point as input and should return a number. A string indicates the object attribute to use. |
d => d[1] |
| xMin([number]) | Getter/setter for the x axis minimum value. By default (undefined), the min X is calculated dynamically from the data. |
undefined |
| xMax([number]) | Getter/setter for the x axis maximum value. By default (undefined), the max X is calculated dynamically from the data. |
undefined |
| yExtent([number]) | Getter/setter for the y axis maximum absolute value. By default (undefined), the max Y is calculated dynamically from the data. |
undefined |
| yScaleExp([number]) | Getter/setter for the y axis scale exponent. Only values > 0 are supported. An exponent of 1 (default) represents a linear Y scale. |
1 |
| yAggregation([fn([numbers])]) | Getter/setter for the method to reduce multiple values to a single number, in case there is more than one y value per unique x. |
vals => vals.reduce((a,b) => a+b) (accumulate) |
| bands([int]) | Getter/setter for the number of horizon bands to use. | 4 |
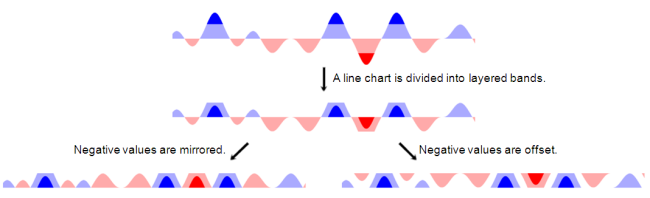
| mode(['offset' or 'mirror']) | Getter/setter for the mode used to represent negative values. offset renders the negative values from the top of the chart downwards, while mirror represents them upwards as if they were positive values, albeit with a different color. |
offset |
| positiveColors([[colors]]) | Getter/setter for the colors to use for the positive value bands. The top band gets assigned the max color, and the other bands are colored according to the interpolation of the color stops. Minimum two colors are required. | ['white', 'midnightBlue'] |
| positiveColorStops([[stopNumbers]]) | Getter/setter for the stop values to use in the interpolation of the positive colors. Each stop represents an interpolation ratio and only values between ]0, 1[ (excluding) are permitted. The stops are used to interpolate the middle colors in positiveColors and are only applicable if there are more than 2 colors. If the number of stops is less than number of middle colors, linear interpolation is used to populate the remaining stops. A value of undefined (default) results in complete linear interpolation. |
undefined |
| negativeColors([[colors]]) | Getter/setter for the colors to use for the negative value bands. The top band gets assigned the max color, and the other bands are colored according to the interpolation of the color stops. Minimum two colors are required. | ['white', 'crimson'] |
| negativeColorStops([[stopNumbers]]) | Getter/setter for the stop values to use in the interpolation of the negative colors. Each stop represents an interpolation ratio and only values between ]0, 1[ (excluding) are permitted. The stops are used to interpolate the middle colors in negativeColors and are only applicable if there are more than 2 colors. If the number of stops is less than number of middle colors, linear interpolation is used to populate the remaining stops. A value of undefined (default) results in complete linear interpolation. |
undefined |
| interpolationCurve([d3CurveFn]) | Getter/setter for the interpolation curve function used to draw lines between points. Should be a d3 curve function. A falsy value sets linear interpolation (curveLinear). |
curveBasis |
| duration([ms]) | Getter/setter for the duration (in milliseconds) of the transitions between states. | 0 |
| tooltipContent([fn({x, y, points})]) | Getter/setter for the tooltip content accessor function. Accepts plain-text or HTML. A value of null will permanently hide the tooltip. |
({ x, y }) => `${x}: ${y}` |
| onHover([fn({x, y, points})]) | Callback function for chart hover events. Gets triggered every time the mouse moves in/out of a different point hover area. Includes the point information as single argument, with x, y and points (list of all data points associated with the corresponding x value) data. If no point is in the x proximity of the mouse pointer, a value of null is returned instead. |
- |
| onClick([fn({x, y, points})]) | Callback function for chart click events. Includes the currently hovered point information as single argument, with x, y and points (list of all data points associated with the corresponding x value) data. If no point is in the x proximity of the mouse pointer, a value of null is returned instead. |
- |