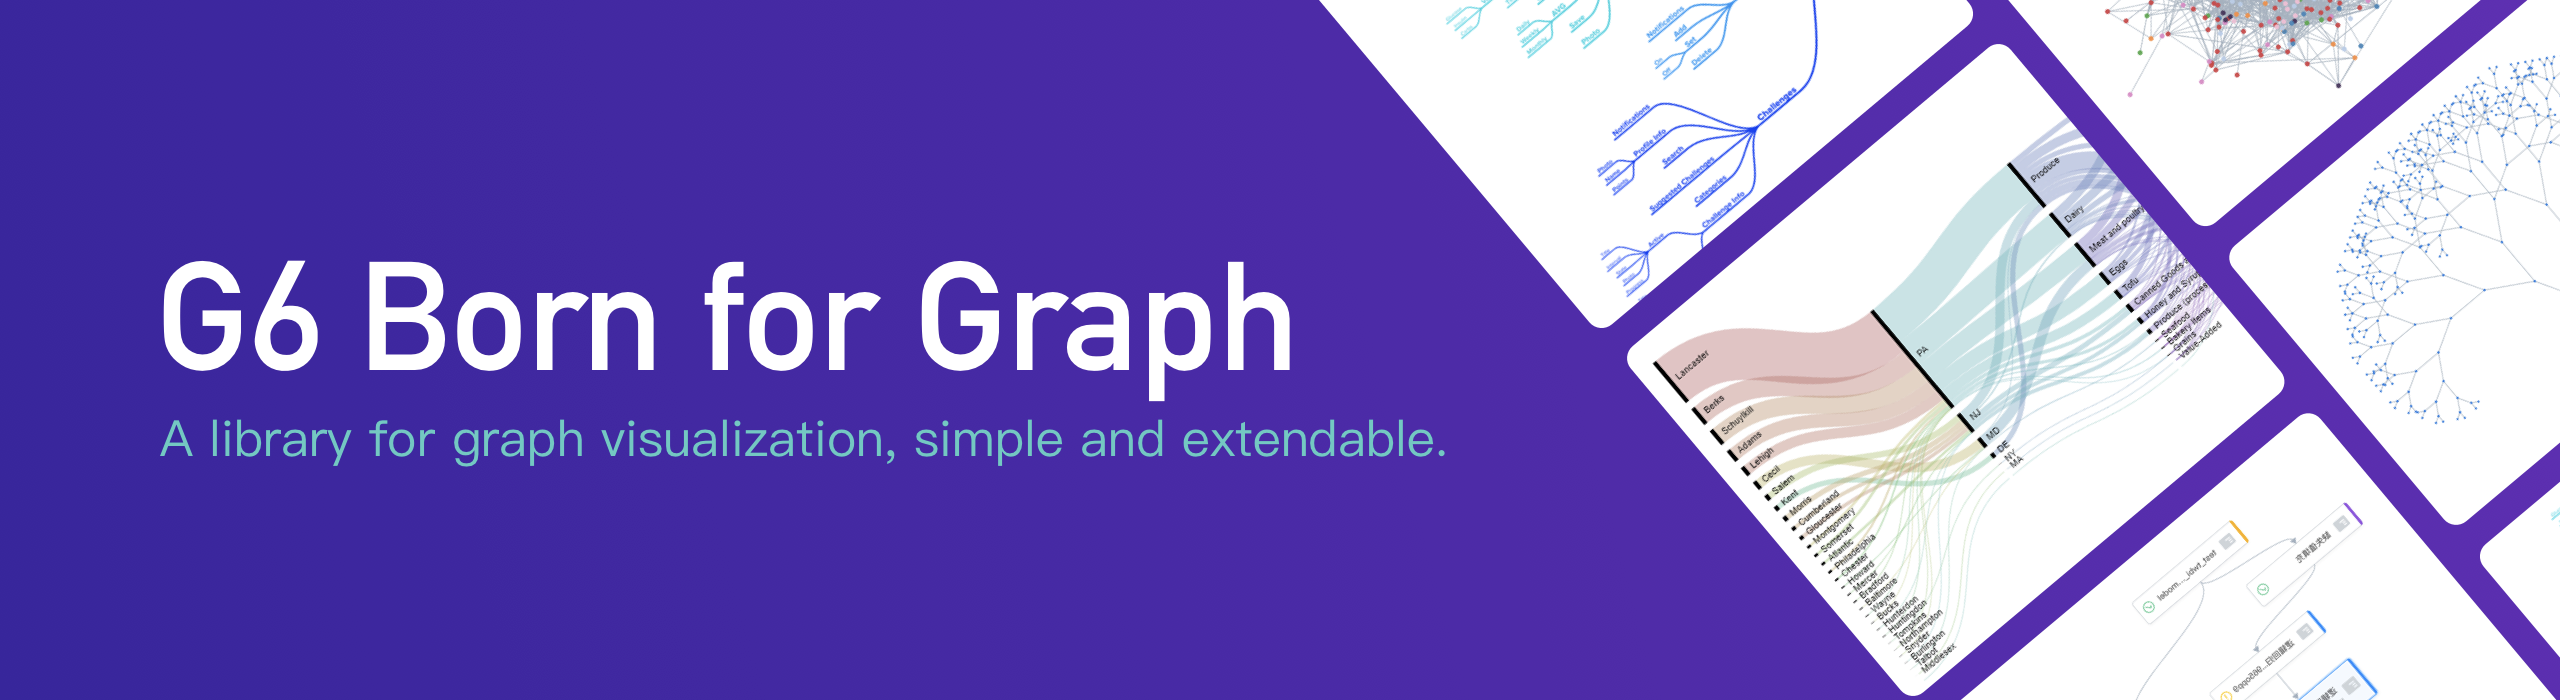
G6: A Graph Visualization Framework in JavaScript.

![]()
![]()


![]()
G6 is a graph visualization framework which provides a set of basic mechanisms. Developers are able to build graph visualization analysis application or graph visualization modeling application easily. For more details, please see our doc.


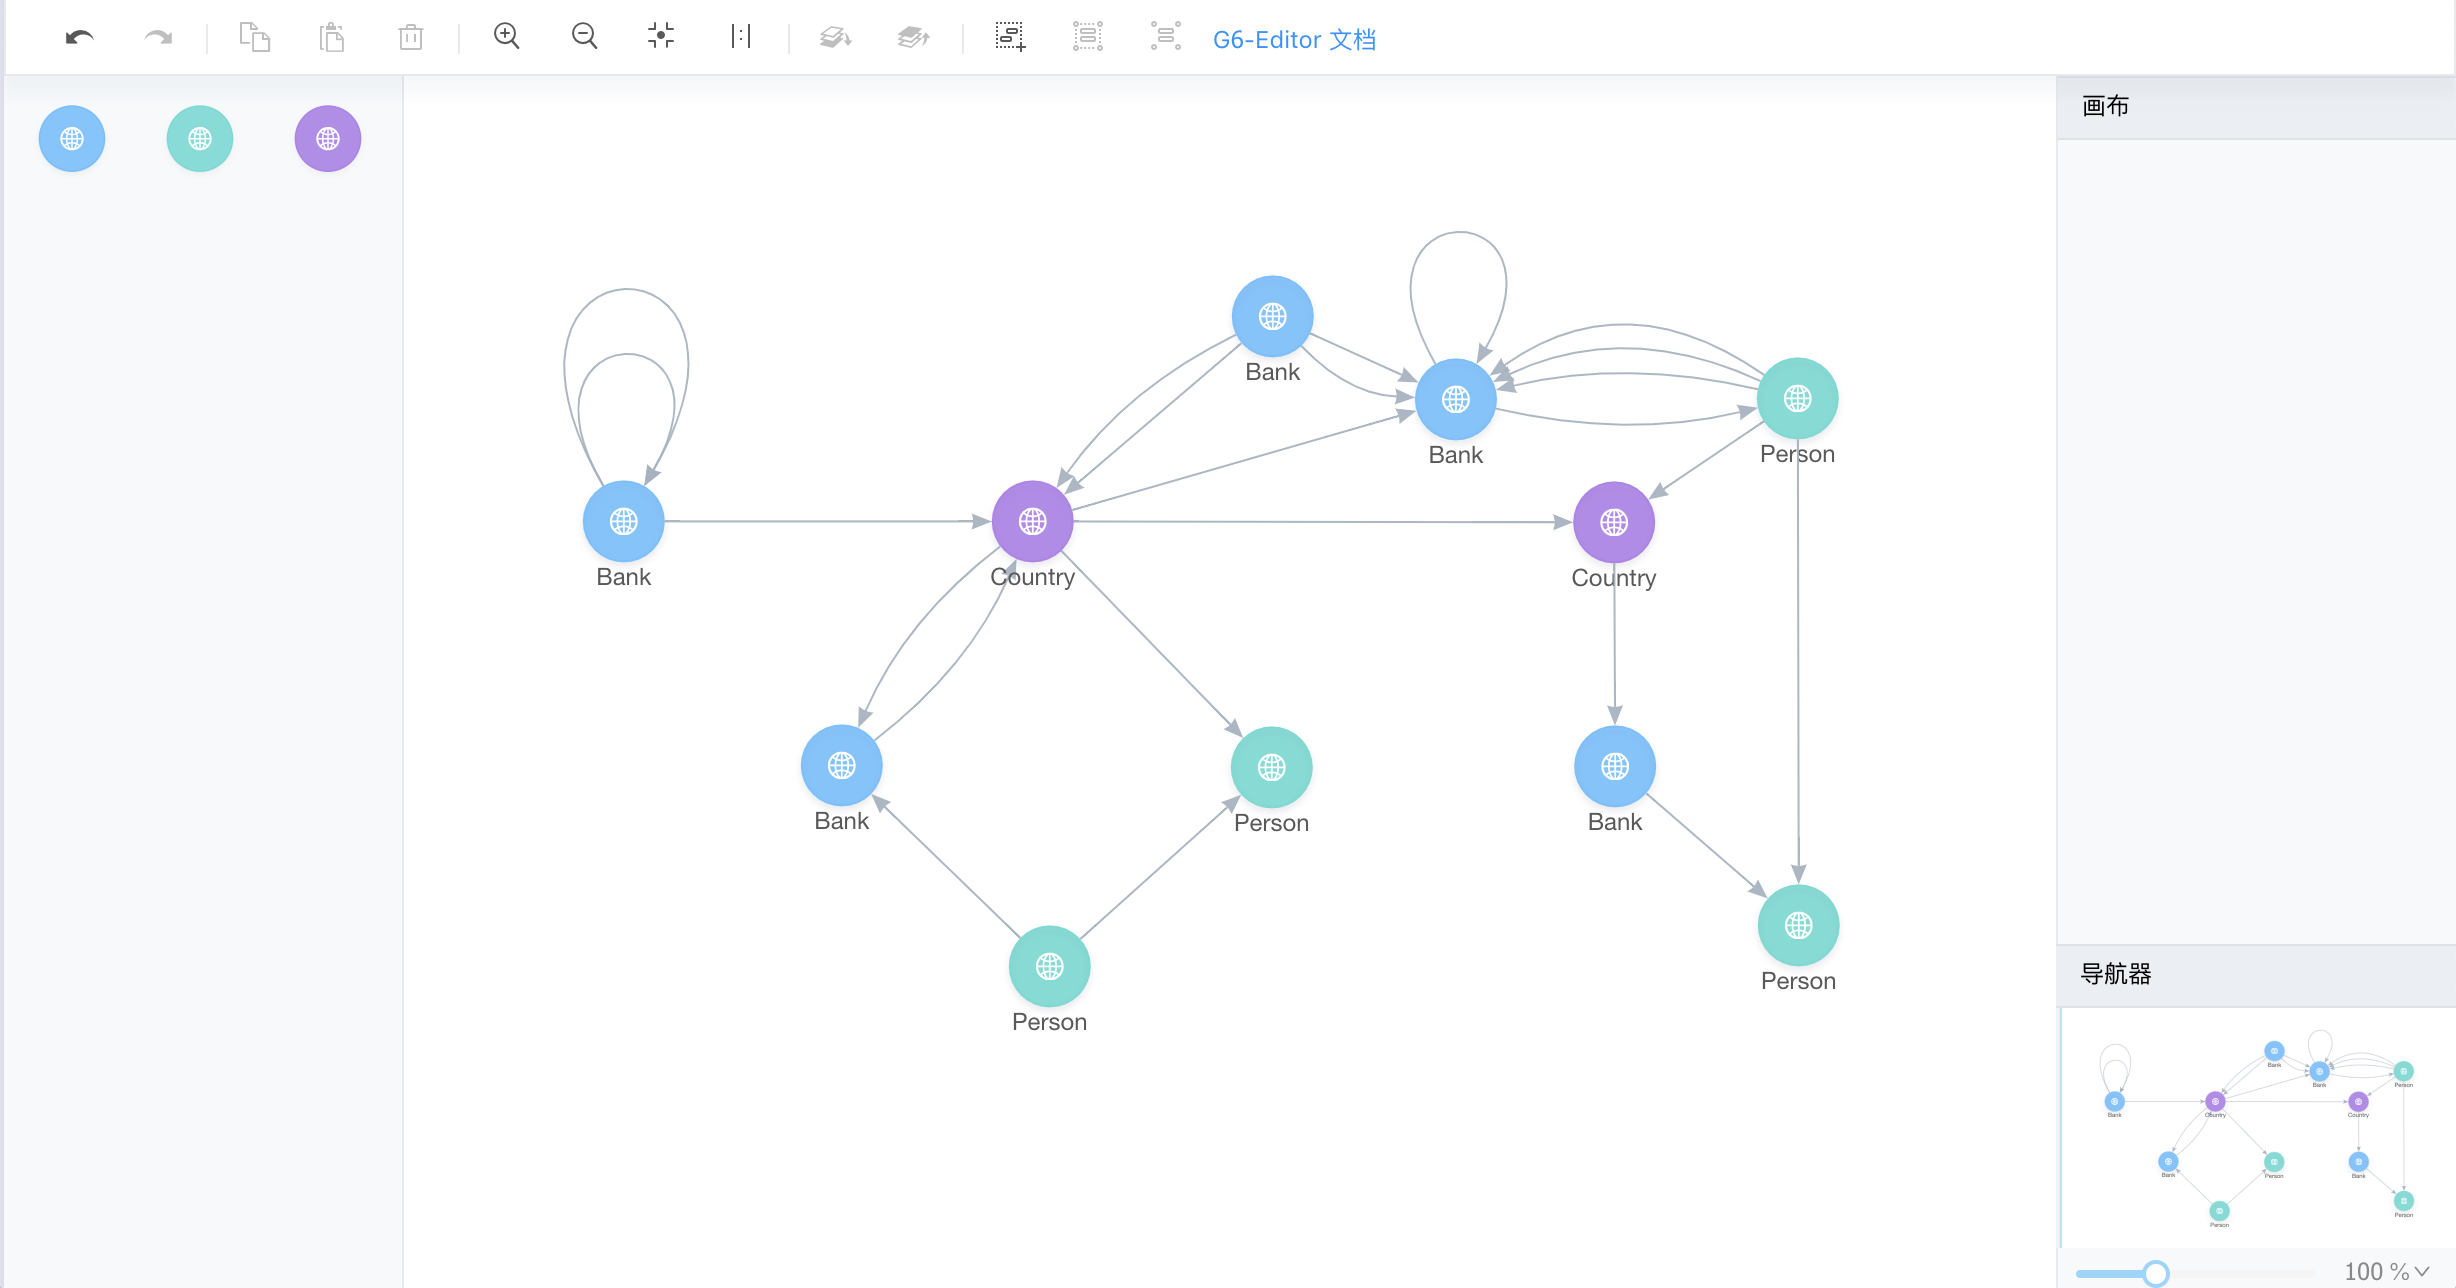
G6-Editor


G6-Analyzer [coming soon]

Installation
$ npm install @antv/g6
Usage
; const data = nodes: id: 'node1' x: 100 y: 200 id: 'node2' x: 300 y: 200 edges: target: 'node2' source: 'node1' ;const graph = container: 'mountNode' width: 500 height: 500 nodeStyle: default: fill: '#40a9ff' stroke: '#096dd9' edgeStyle: default: stroke: '#A3B1BF' ;graph;Development
$ npm install # run test case $ npm run test-live # build watching file changes and run demos $ npm run devHow to Contribute
Please let us know how can we help. Do check out issues for bug reports or suggestions first.
To become a contributor, please follow our contributing guide.